Standardised Classification of Effects Based on Their Uncertainty
Thierry Onkelinx
classification.RmdA Simple, Stable and Transparent Classification of Effects
The effectclass package provides functions to classify effects in a stable and transparent manner. We base the classification on the lower and upper bounds of a confidence (or credible) interval, focussing on the uncertainty rather than the point estimates. First, we compare the confidence interval with a reference. This reference typically refers to the null hypothesis. An effect with confidence interval above the reference is a significant (important) effect. Let’s call this a positive effect. Likewise, a negative effect has a confidence interval below the reference.
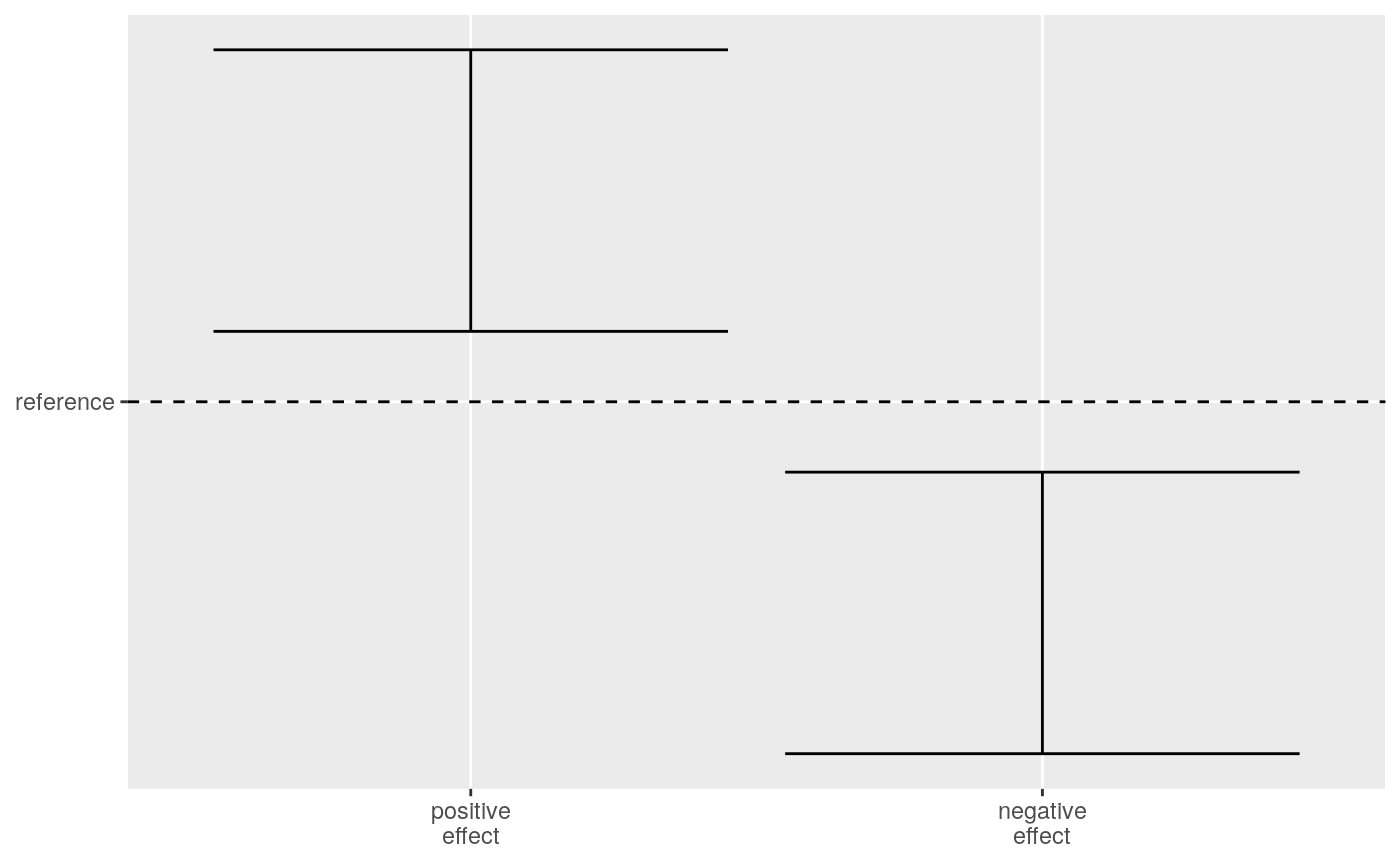
Comparing confidence intervals to the reference.
But what if the confidence interval contains the reference? Then the width of the confidence interval plays an important role. Suppose the confidence interval is wide. The value of the effect can range from a strong negative effect over no effect to a strong positive effect. Basically, we have no information on the effect. On the other hand, suppose we have a narrow confidence interval. The effect still is either positive or negative, but we know that it won’t be a strong positive nor strong negative effect. We could define a lower1 and upper2 threshold and use them to separate confidence intervals that contain the reference. If the confidence interval is between both the upper and lower threshold, we can state that the effect does not exceed these thresholds. We set the thresholds at a level where we can consider the effect to be not relevant so we can call this no effect. As soon as the confidence interval contains the reference and at least one of the thresholds, we consider it an unknown effect.
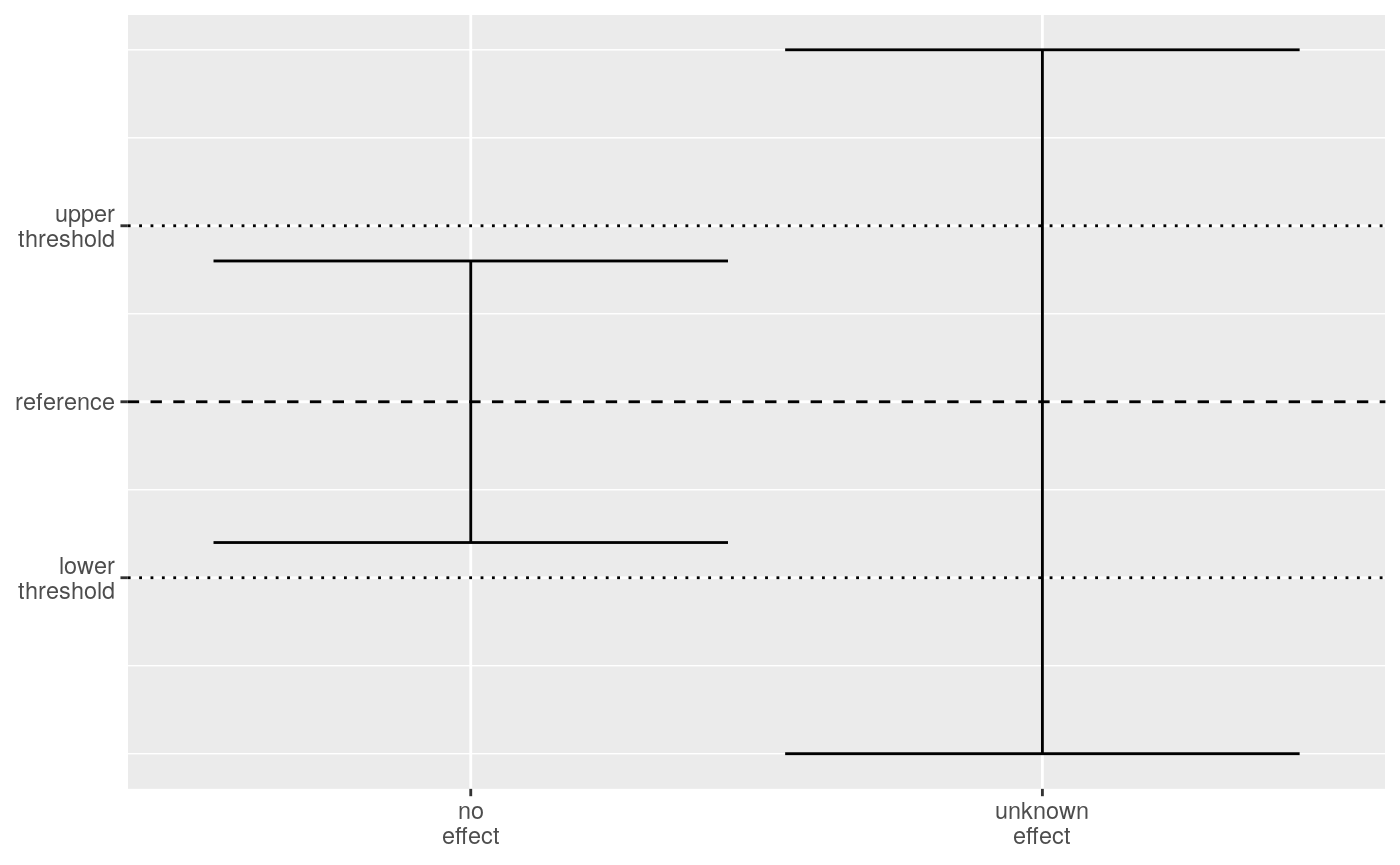
Comparing confidence intervals to the reference and thresholds.
Comparing the confidence interval with a reference and two thresholds, gives us four distinct categories. The table below lists the rules for each category and suggests a symbol and standardised wording for effects and trends.
| Symbol | Effect | Trend | Rules |
|---|---|---|---|
+ |
positive effect | increase | confidence interval above reference |
- |
negative effect | decrease | confidence interval below reference |
~ |
no effect | stable | confidence interval between thresholds |
? |
unknown effect | unknown | confidence interval contains reference and at least one threshold |
A Detailed Classification
The upper threshold divides the zone of a positive effect. Suppose the confidence interval is between the reference and the upper threshold. The confidence interval is above the reference so there is a positive effect. At the same time, the confidence interval is also below the upper threshold which would lead to no effect if the confidence interval contains the reference. We suggest the term moderate positive effect for this situation. A confidence interval above the upper threshold is outside of the no effect zone. We suggest the term strong positive effect for this situation. We keep the term positive effect when the confidence interval is above the reference and contains the upper threshold.
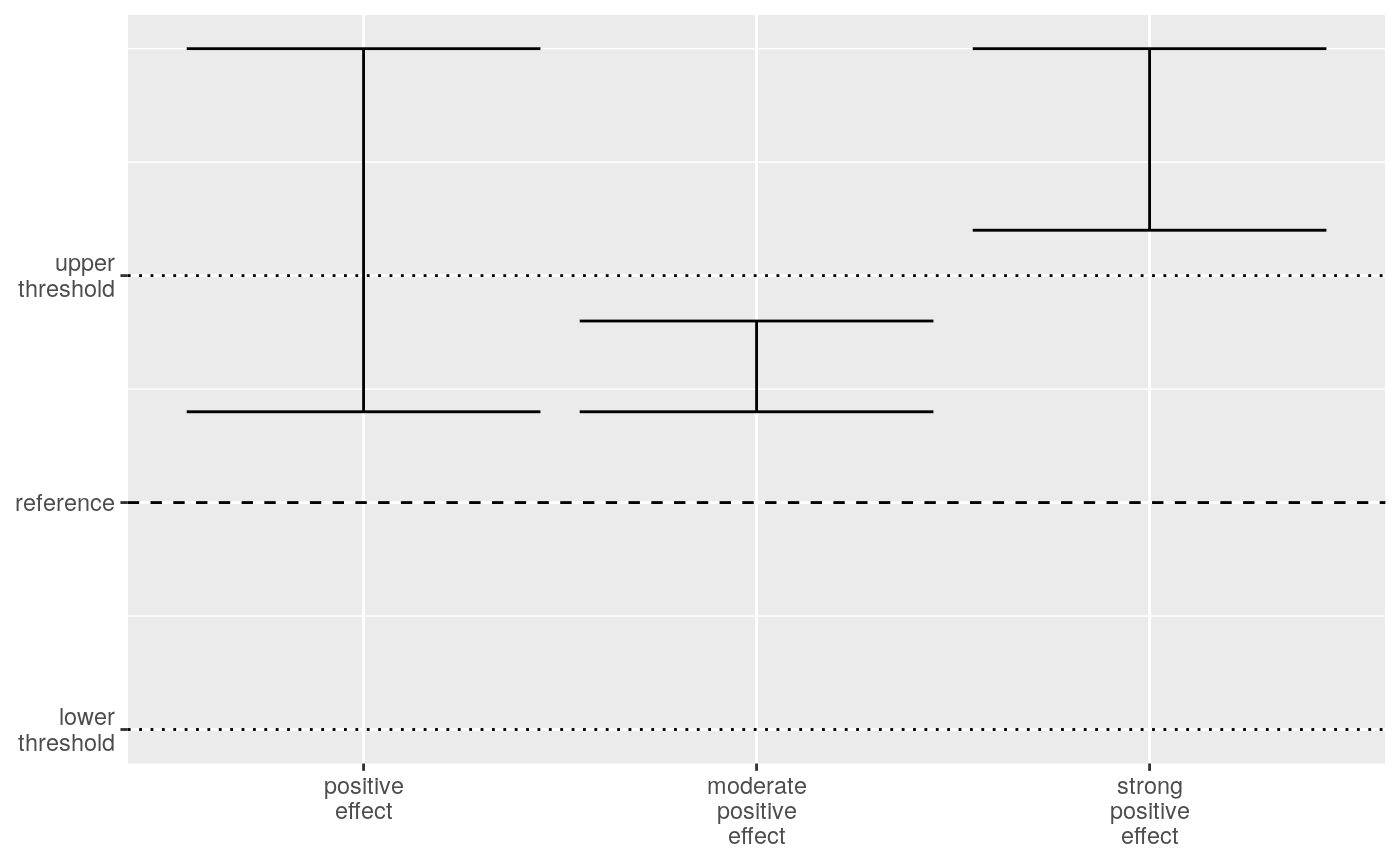
Comparing confidence intervals to the reference and thresholds for positive effects.
We split the negative effect in a strong negative effect, moderate negative effect and negative effect using analogous rules as for the positve effect. Except that we use the lower threshold instead of the upper threshold. The no effect class remains as is.
When the unknown effect case contains the reference and upper threshold but not the lower threshold, we known that we can exclude a strong negative effect. We classify such an effect as a potential positive effect. Similarly, when the confidence interval contains the reference and the lower threshold but not the upper threshold, we call it a potential negative effect. If the confidence interval contains both the lower and upper threshold, we call it an unknown effect.
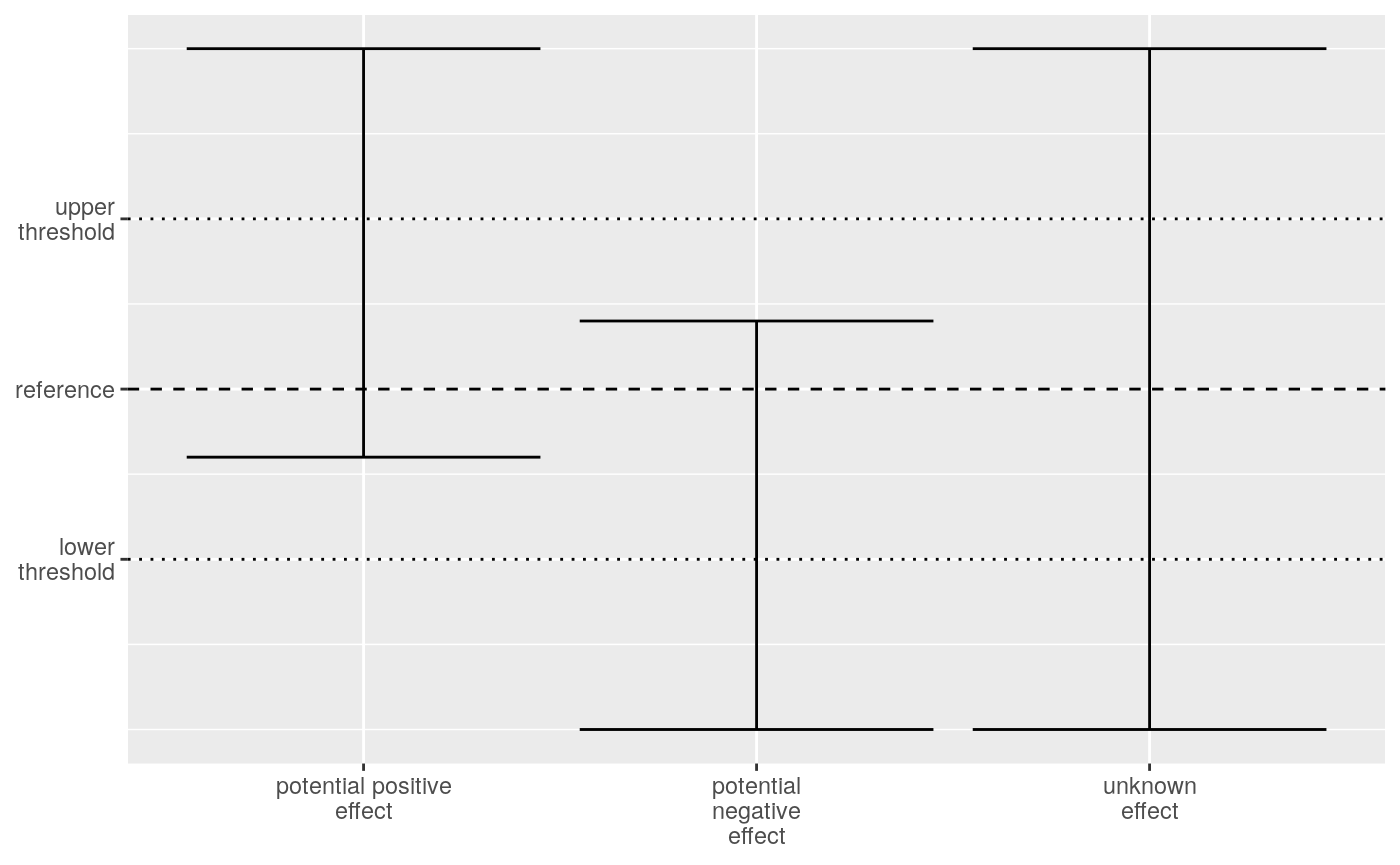
Comparing confidence intervals to the reference and thresholds for unknown effects.
The table below gives an overview of the ten classes that we can distinct based on the reference, lower and upper threshold. Note that four classes get the same symbol and terminology as in the four class classification. Those classes have wide confidence intervals and we can’t refine the classification. The six other classes get a two digit symbol. They inherit their first symbol from the four class classification. The second digit refines the classification, using the same symbols as a kind of modifier. The terminology of these six classes uses in principle their four class classification plus a modifying adjective (strong or moderate). The unknown class is an exception. Here we use the potential adjective in combination with positive effect or negative effect.
| Symbol | Effect | Trend | Rules | Thresholds in the interval |
|---|---|---|---|---|
++ |
strong positive effect | strong increase | confidence interval above the upper threshold | 0 |
+ |
positive effect | increase | confidence interval above reference and contains the upper threshold | 1 |
+~ |
moderate positive effect | moderate increase | confidence interval between reference and the upper threshold | 0 |
~ |
no effect | stable | confidence interval between thresholds | 1 |
-~ |
moderate negative effect | moderate decrease | confidence interval between reference and the lower threshold | 1 |
- |
negative effect | decrease | confidence interval below reference and contains the lower threshold | 1 |
-- |
strong negative effect | strong decrease | confidence interval below the lower threshold | 0 |
?+ |
potential positive effect | potential increase | confidence interval contains reference and the upper threshold | 2 |
?- |
potential negative effect | potential decrease | confidence interval contains reference and the lower threshold | 2 |
? |
unknown effect | unknown | confidence interval contains the lower and upper threshold | 3 |
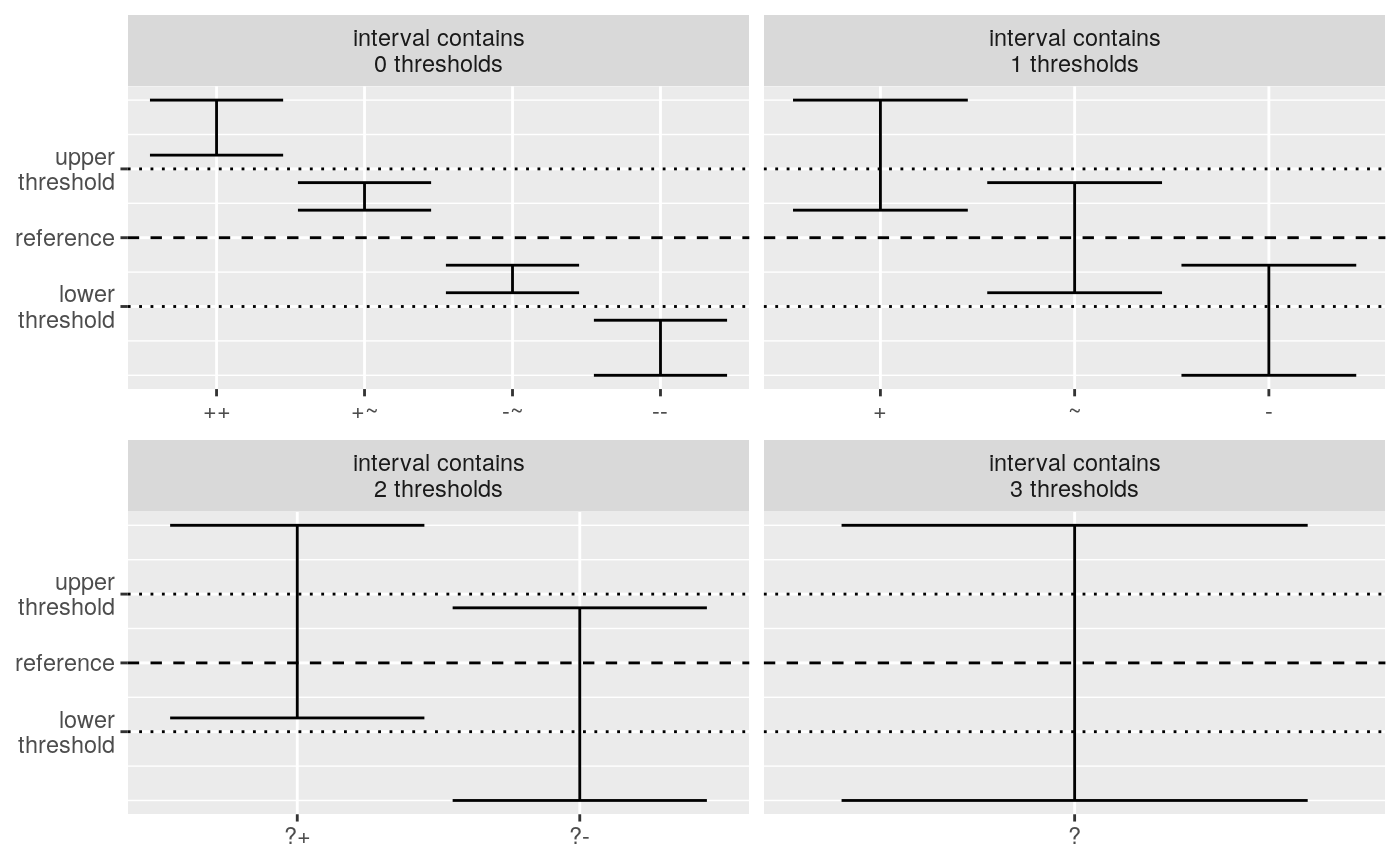
Graphical overview of the ten class classification split by the number of thresholds in the confidence interval.
Classification Using effectclass
The effectclass package provides classification() for classifying confidence intervals. The function requires a vector of lower bounds of the confidence intervals (ucl) and a vector of upper bounds (ucl). It also requires the lower and upper thresholds (threshold) as a two-element vector. In case the thresholds are symmetric around the reference, you can provide a single value which is the absolute difference between the reference and both thresholds. The default reference is zero. classification() returns a ten level factor using the two digits symbols mentioned above. The levels range from strong positive effect over no effect to strong negative effect. The potential and unknown levels end the row.
ds <- data.frame(
  lcl =        c(-5, -5, -5, -5, -2, -2, -2, 1, 1, 4),
  ucl =        c( 5,  2, -1, -4,  5,  2, -1, 5, 2, 5)
)
library(effectclass)
ds$effect <- classification(lcl = ds$lcl, ucl = ds$ucl, threshold = 3)
ds <- ds[order(ds$effect), ]
kable(ds, row.names = FALSE)| lcl | ucl | effect |
|---|---|---|
| 4 | 5 | ++ |
| 1 | 5 | + |
| 1 | 2 | +~ |
| -2 | 2 | ~ |
| -2 | -1 | -~ |
| -5 | -1 | - |
| -5 | -4 | – |
| -2 | 5 | ?+ |
| -5 | 2 | ?- |
| -5 | 5 | ? |
coarse_classification() converts the ten classes into the corresponding four classes. The factor has the four single digit levels in a similar order as the ten class factor.
| lcl | ucl | effect | coarse |
|---|---|---|---|
| 4 | 5 | ++ | + |
| 1 | 5 | + | + |
| 1 | 2 | +~ | + |
| -2 | 2 | ~ | ~ |
| -2 | -1 | -~ | - |
| -5 | -1 | - | - |
| -5 | -4 | – | - |
| -2 | 5 | ?+ | ? |
| -5 | 2 | ?- | ? |
| -5 | 5 | ? | ? |
In some cases we are not interested in the sign of the effect. remove_sign() recodes the ten classes into six and the four classes into three. It replaces + and - by *.
ds$unsigned_10 <- remove_sign(ds$effect)
ds$unsigned_4 <- remove_sign(ds$coarse)
kable(ds, row.names = FALSE)| lcl | ucl | effect | coarse | unsigned_10 | unsigned_4 |
|---|---|---|---|---|---|
| 4 | 5 | ++ | + | ** | * |
| 1 | 5 | + | + | * | * |
| 1 | 2 | +~ | + | *~ | * |
| -2 | 2 | ~ | ~ | ~ | ~ |
| -2 | -1 | -~ | - | *~ | * |
| -5 | -1 | - | - | * | * |
| -5 | -4 | – | - | ** | * |
| -2 | 5 | ?+ | ? | ?* | ? |
| -5 | 2 | ?- | ? | ?* | ? |
| -5 | 5 | ? | ? | ? | ? |
Suggestion for Displaying Effects in a Tabular Format
We recommend to publish at least the confidence interval and its classification in a table. You could add the point estimate too, but never without the confidence interval. Think about a relevant sorting order of the rows in the table. The example below displays the effect in decreasing order with uncertain effects at the bottom. Note that we first sort on the classification and then on the point estimate. We added a format() function for your convenience. A double hyphen -- is rendered in Markdown as a so-called em-dash ‘–’. Use the type = "markdown" argument of format() to convert the classifaction as verbatim text, which preserves the double hyphen when rendering the document. The type = "plot" argument displays the symbols used on the plots.
set.seed(20191126)
n <- 50
ds <- data.frame(
  effect = paste0(
    sample(LETTERS, n, replace = TRUE),
    sample(LETTERS, n, replace = TRUE),
    sample(LETTERS, n, replace = TRUE)
  ),
  point_estimate = runif(n, min = -2, max = 2),
  se = runif(n)
)
ds$lcl <- qnorm(p = 0.025, mean = ds$point_estimate, sd = ds$se)
ds$ucl <- qnorm(p = 0.975, mean = ds$point_estimate, sd = ds$se)
ds$estimate <- sprintf("%.2f (%.2f; %.2f)", ds$point_estimate, ds$lcl, ds$ucl)
ds$class <- classification(lcl = ds$lcl, ucl = ds$ucl, threshold = 1)
tab <- ds[order(ds$class, -ds$point_estimate), c("effect", "estimate", "class")]
tab$markdown <- format(tab$class, type = "markdown")
tab$plot <- format(tab$class, type = "plot")
kable(
  tab,
  caption = "Example table with effects, their confidences interval and
  classification using different formatting styles.",
  row.names = FALSE,
  align = "c"
)| effect | estimate | class | markdown | plot |
|---|---|---|---|---|
| LQV | 1.98 (1.22; 2.74) | ++ | ++ |
▲ |
| OYD | 1.69 (1.24; 2.15) | ++ | ++ |
▲ |
| YLP | 1.31 (1.13; 1.48) | ++ | ++ |
▲ |
| SFE | 1.13 (1.05; 1.21) | ++ | ++ |
▲ |
| IWJ | 1.11 (1.04; 1.17) | ++ | ++ |
▲ |
| BEK | 1.98 (0.63; 3.33) | + | + |
▸ |
| LII | 1.59 (0.86; 2.32) | + | + |
▸ |
| YGL | 1.35 (0.99; 1.70) | + | + |
▸ |
| EAU | 1.16 (0.51; 1.82) | + | + |
▸ |
| QHQ | 1.12 (0.95; 1.29) | + | + |
▸ |
| SZU | 1.01 (0.74; 1.29) | + | + |
▸ |
| OHA | 0.98 (0.49; 1.47) | + | + |
▸ |
| HEB | 0.75 (0.59; 0.91) | +~ | +~ |
◓ |
| CUC | 0.62 (0.55; 0.68) | +~ | +~ |
◓ |
| KIR | 0.02 (-0.12; 0.16) | ~ | ~ |
◉ |
| NCT | 0.00 (-0.19; 0.20) | ~ | ~ |
◉ |
| RAQ | -0.13 (-0.65; 0.39) | ~ | ~ |
◉ |
| THF | -0.26 (-0.42; -0.09) | -~ | -~ |
◒ |
| ACJ | -0.84 (-1.61; -0.07) | - | - |
◂ |
| YVA | -0.92 (-1.69; -0.15) | - | - |
◂ |
| QDR | -0.93 (-1.28; -0.59) | - | - |
◂ |
| YFI | -0.96 (-1.76; -0.15) | - | - |
◂ |
| STC | -1.06 (-1.30; -0.82) | - | - |
◂ |
| TDJ | -1.14 (-2.27; -0.01) | - | - |
◂ |
| CEZ | -1.40 (-2.60; -0.20) | - | - |
◂ |
| YEV | -1.46 (-2.17; -0.76) | - | - |
◂ |
| CNC | -1.96 (-3.05; -0.88) | - | - |
◂ |
| TBL | -1.83 (-2.12; -1.54) | – | -- |
▼ |
| WAP | -1.86 (-2.54; -1.17) | – | -- |
▼ |
| BLH | 1.75 (-0.04; 3.55) | ?+ | ?+ |
△ |
| FVU | 1.46 (-0.47; 3.38) | ?+ | ?+ |
△ |
| YOX | 1.13 (-0.16; 2.43) | ?+ | ?+ |
△ |
| SLR | 1.07 (-0.64; 2.77) | ?+ | ?+ |
△ |
| PCA | 0.81 (-0.71; 2.33) | ?+ | ?+ |
△ |
| AWV | 0.80 (-0.90; 2.50) | ?+ | ?+ |
△ |
| RFO | -0.39 (-1.32; 0.54) | ?- | ?- |
▽ |
| YZO | -0.48 (-1.23; 0.27) | ?- | ?- |
▽ |
| RRO | -0.53 (-2.04; 0.98) | ?- | ?- |
▽ |
| JAT | -0.57 (-1.16; 0.01) | ?- | ?- |
▽ |
| UXU | -0.60 (-2.15; 0.94) | ?- | ?- |
▽ |
| GJP | -1.07 (-2.68; 0.54) | ?- | ?- |
▽ |
| EWO | -1.73 (-3.64; 0.18) | ?- | ?- |
▽ |
| BVJ | 0.27 (-1.39; 1.93) | ? | ? |
◇ |
| HUR | 0.15 (-1.18; 1.49) | ? | ? |
◇ |
| QPN | -0.12 (-1.63; 1.39) | ? | ? |
◇ |
| NLC | -0.16 (-1.57; 1.25) | ? | ? |
◇ |
| CRG | -0.37 (-1.99; 1.25) | ? | ? |
◇ |
| RVL | -0.42 (-2.15; 1.32) | ? | ? |
◇ |
| PMZ | -0.52 (-2.31; 1.28) | ? | ? |
◇ |
| KDJ | -0.65 (-2.49; 1.19) | ? | ? |
◇ |