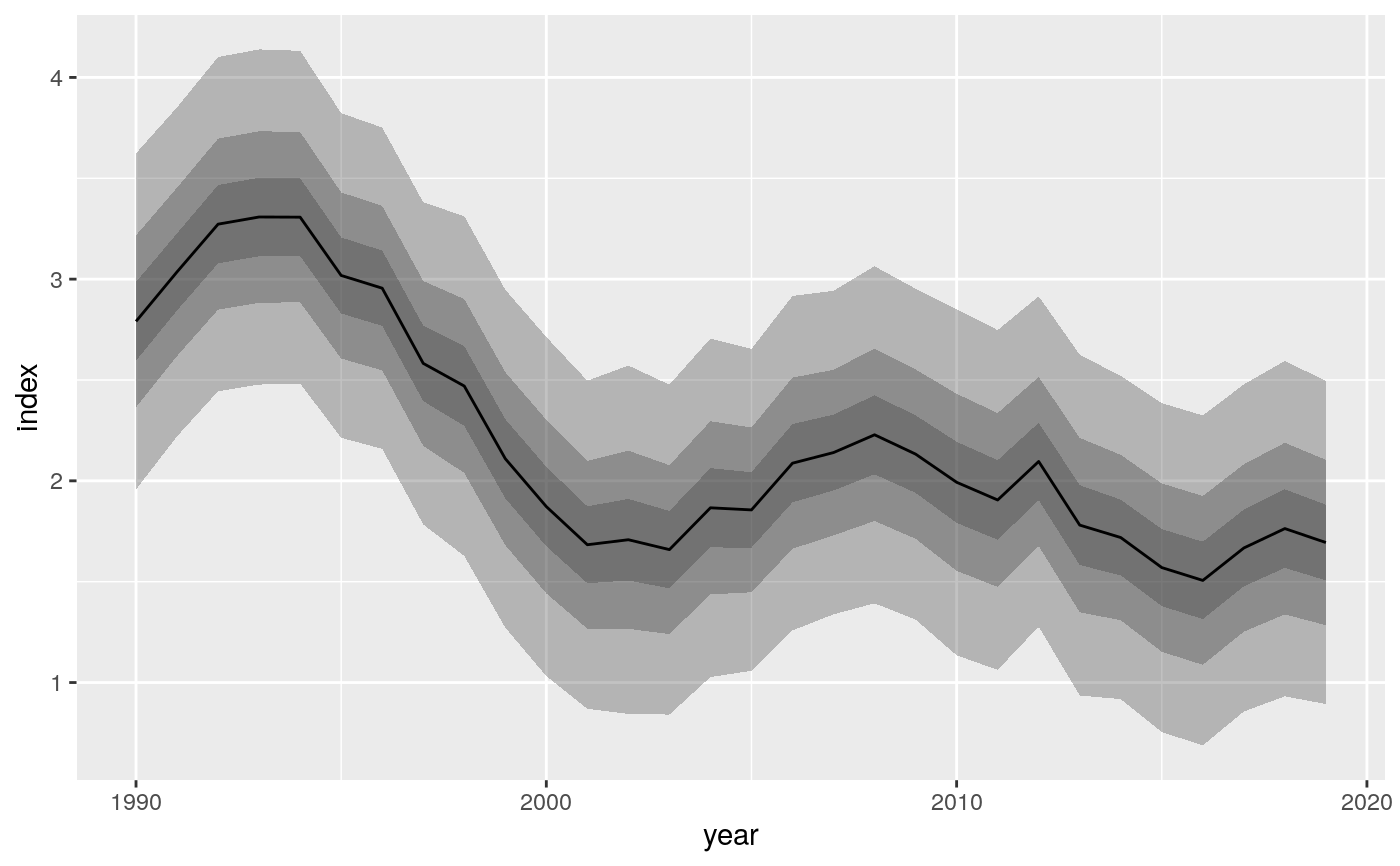
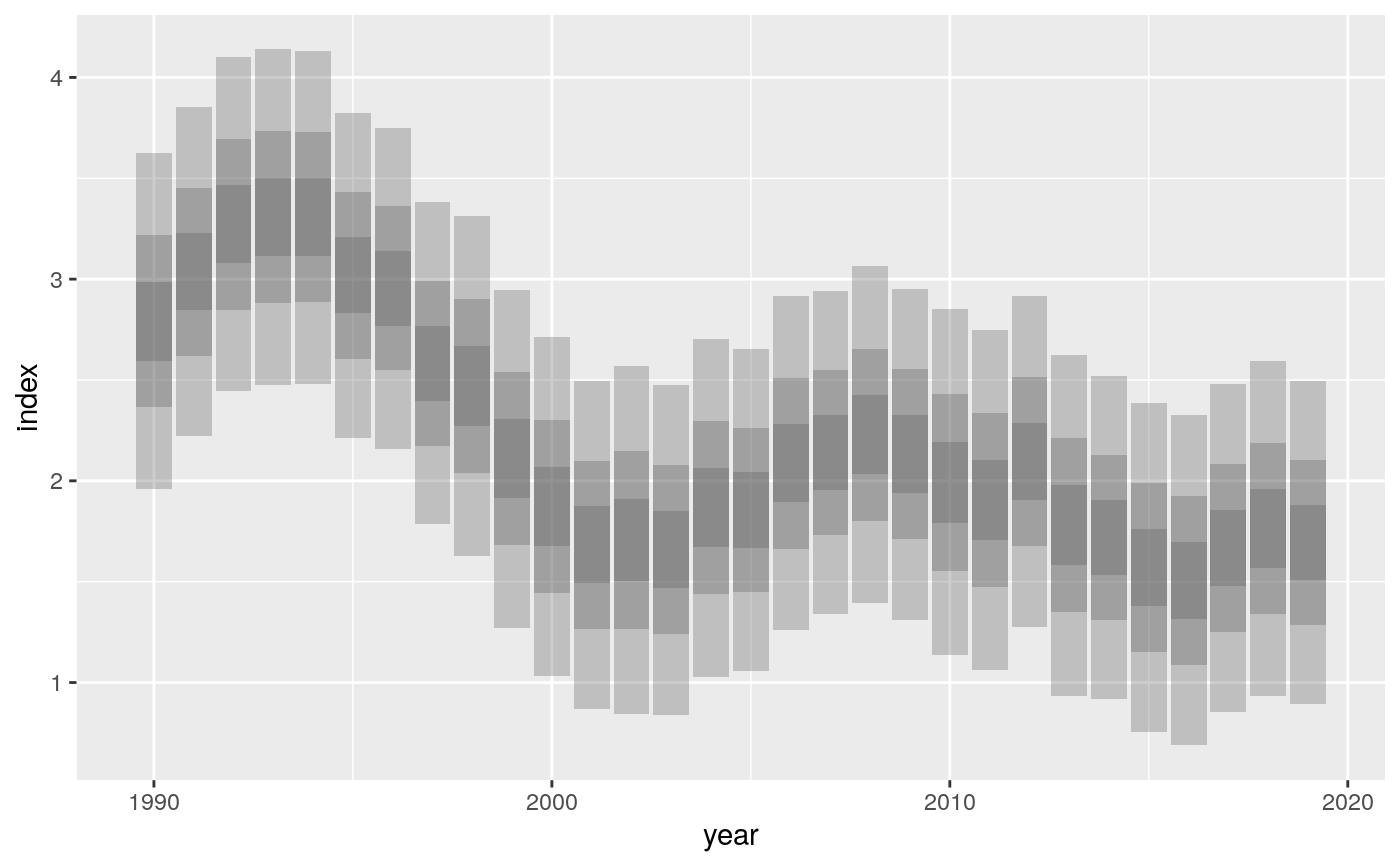
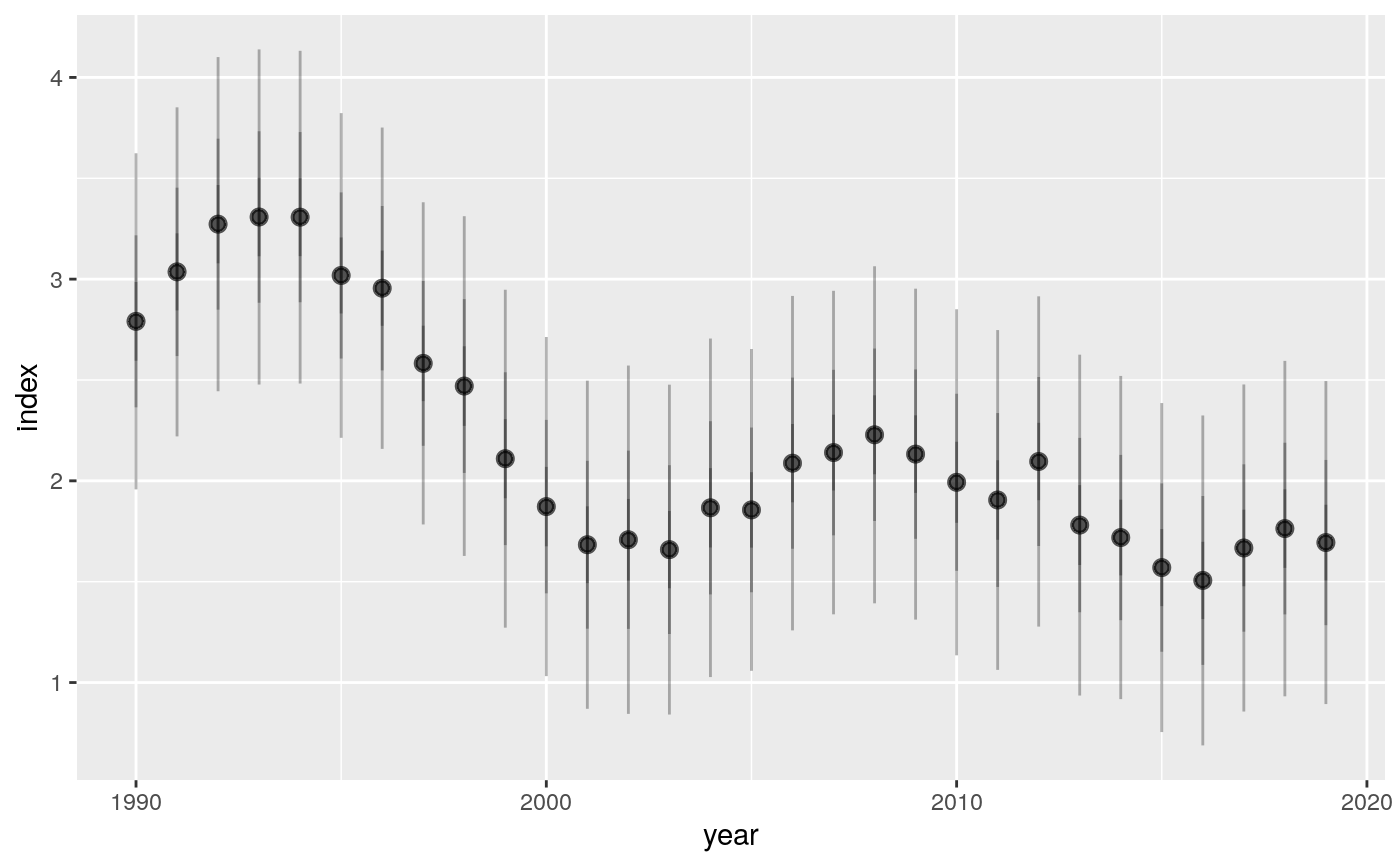
Display a fan plot
stat_fan.RdA fan plot consist of a set of transparent ribbons each representing a
different coverage of the uncertainty around an estimate.
The coverages are based on the assumption of a normal distribution with mean
link(y) and standard error link_sd.
stat_fan(mapping = NULL, data = NULL, position = "identity",
  na.rm = FALSE, show.legend = NA, inherit.aes = TRUE,
  geom = "ribbon", ..., fine = FALSE, link = c("identity", "log",
  "logit"))
Arguments
| mapping | Set of aesthetic mappings created by |
|---|---|
| data | The data to be displayed in this layer. There are three options: If A A |
| position | Position adjustment, either as a string, or the result of a call to a position adjustment function. |
| na.rm | If |
| show.legend | logical. Should this layer be included in the legends?
|
| inherit.aes | If |
| geom | Use a different |
| ... | Other arguments passed on to |
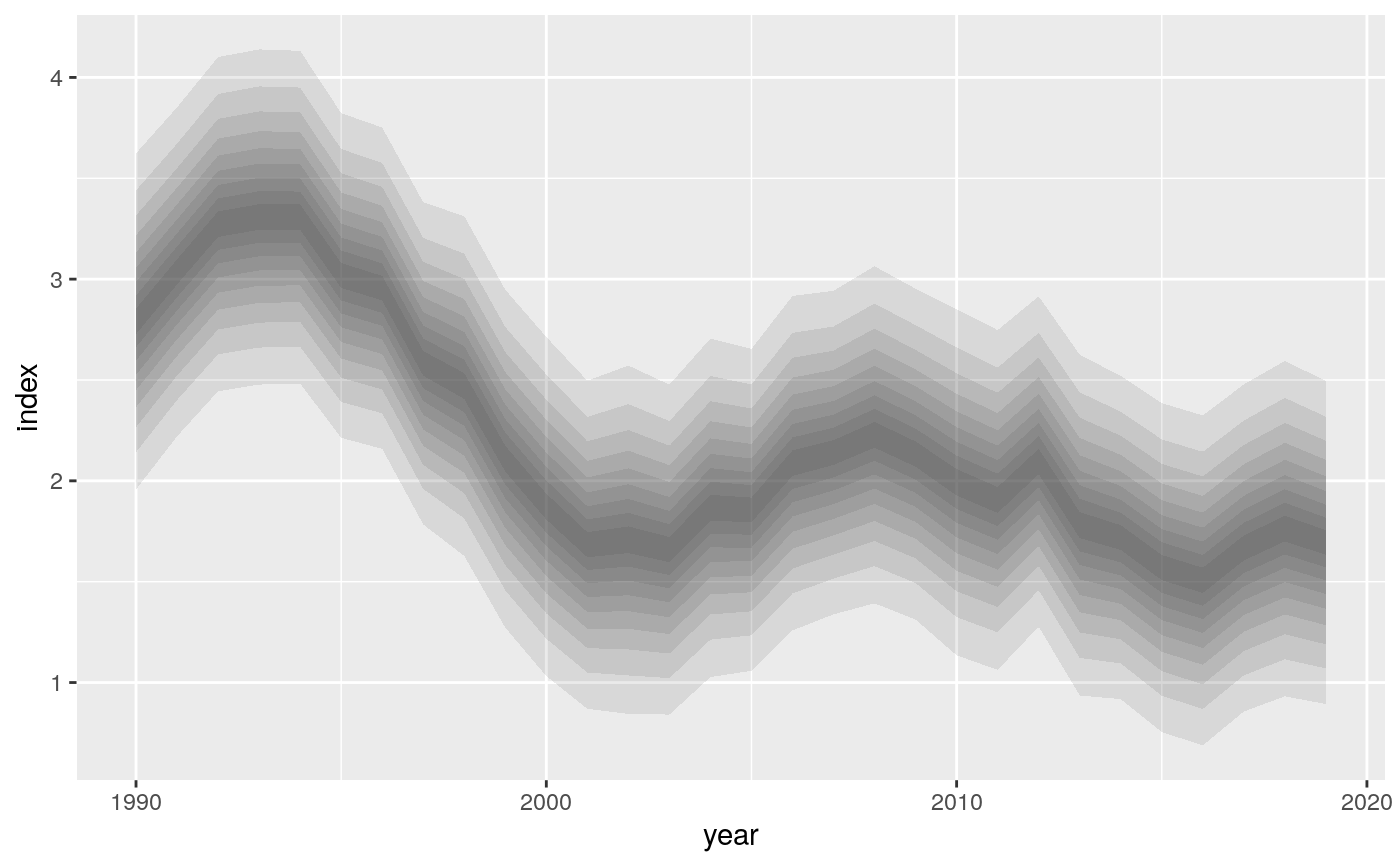
| fine | a logical value.
|
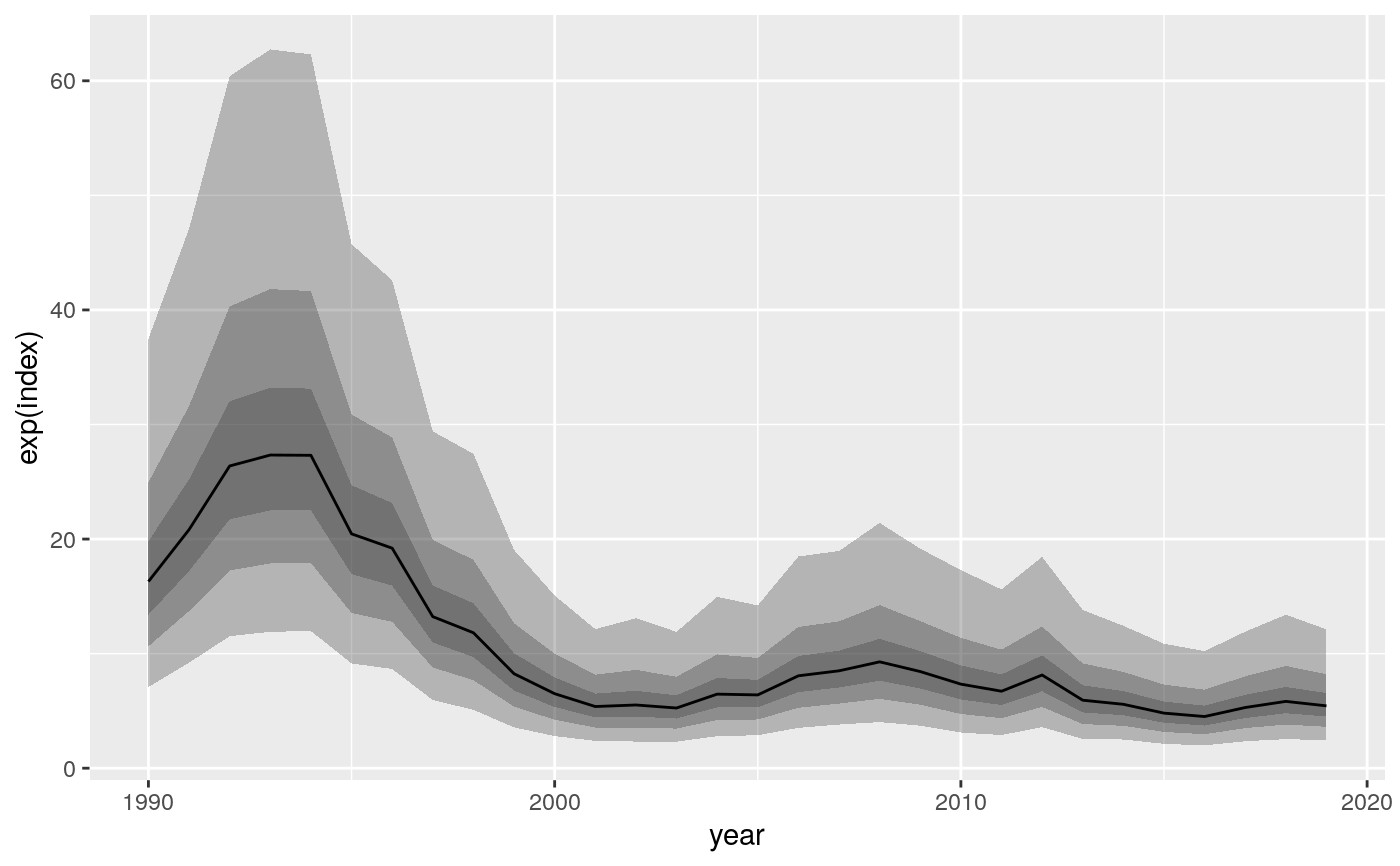
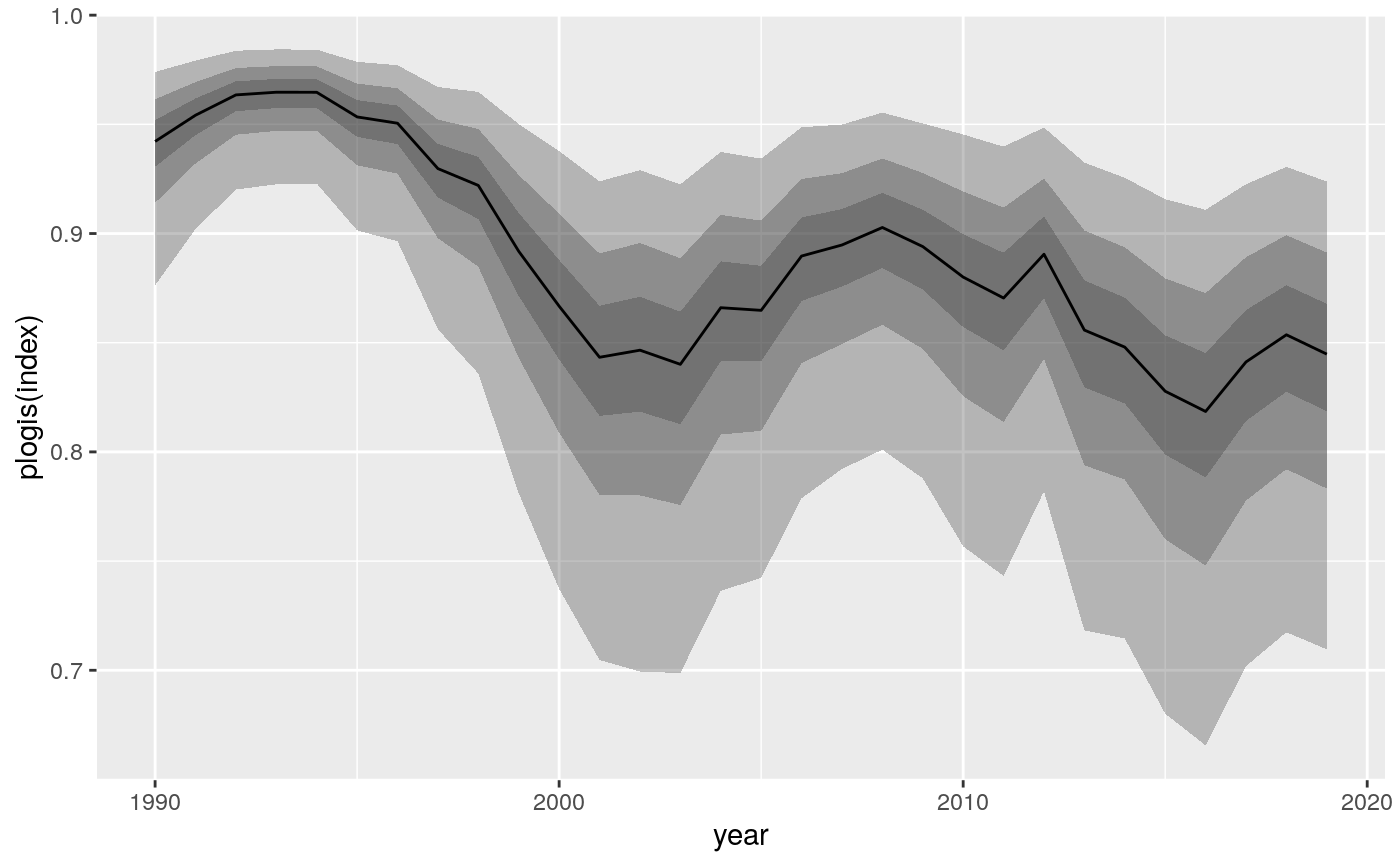
| link | the link function to apply on the |
See also
Other ggplot2: scale_effect,
stat_effect
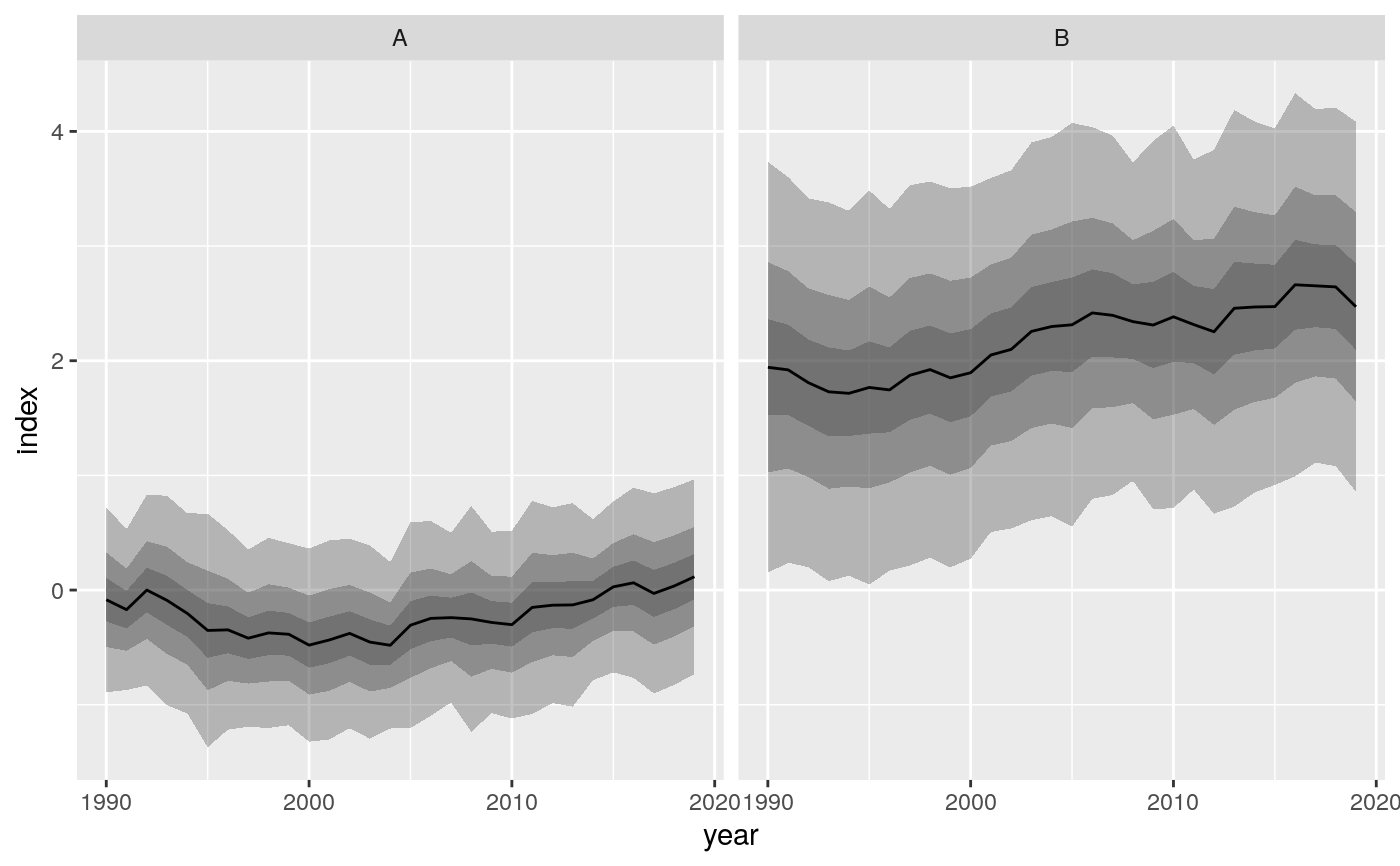
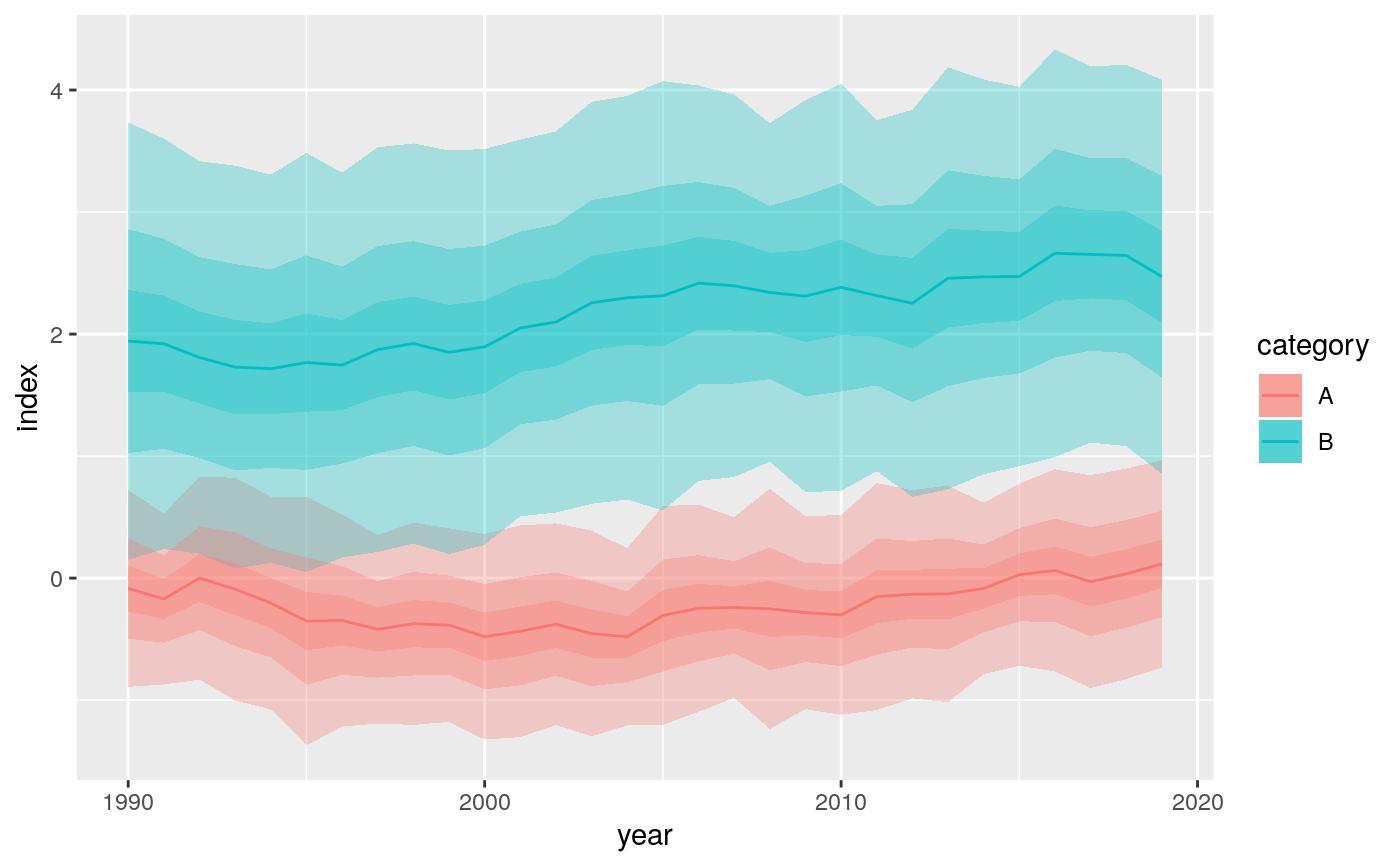
Examples
set.seed(20191218) z <- data.frame( year = 1990:2019, dx = rnorm(30, sd = 0.2), s = rnorm(30, 0.5, 0.01) ) z$index <- 3 + cumsum(z$dx) library(ggplot2) ggplot(z, aes(x = year, y = index, link_sd = s)) + stat_fan()z <- expand.grid(year = 1990:2019, category = c("A", "B")) z$dx <- rnorm(60, sd = 0.1) z$index <- rep(c(0, 2), each = 30) + cumsum(z$dx) z$s <- rnorm(60, rep(c(0.5, 1), each = 30), 0.05) ggplot(z, aes(x = year, y = index, link_sd = s)) + stat_fan() + geom_line() + facet_wrap(~category)ggplot(z, aes(x = year, y = index, link_sd = s)) + stat_fan(aes(fill = category)) + geom_line(aes(colour = category))